Polar Vortex 2026: What the Energy Price Spikes Cost Industrial Facilities and How Automation Changed the Outcome
When the 2026 polar vortex sent electricity prices 50x above normal, facilities running manual processes missed the window entirely. Here's what an automated energy response looked like in real time.
In January and February 2026, a historic polar vortex pushed extreme cold across the Midwest, Northeast, Southeast, and Texas. Energy demand surged. Power plants strained. Grid operators scrambled to maintain stability. And electricity prices did what they always do under stress: they spiked.
In several regions, day-ahead and real-time market rates jumped more than 50x to 100x above normal levels.
- In Maryland, prices climbed from roughly $0.09/kWh to over $4.50/kWh
- In PJM and ERCOT markets, volatility reached 31x, 77x, and even 88x the average rate
The magnitude was extreme for a short duration, but the resulting energy costs are anything but short-term. For industrial facilities caught without an automated response, the financial consequences of the 2026 polar vortex will last years.
What the 2026 Polar Vortex Did to Energy Prices
During the 2026 polar vortex, temperatures dropped rapidly across the country, creating an extreme weather event.
- Heating load increased across residential and commercial sectors
- Grid demand peaked during narrow morning or evening windows
- Transmission systems approached capacity
- Market rates spiked in response to scarcity
Similar grid challenges happen during summer heatwaves.
Why Rate Spikes & Coincident Peaks Matter
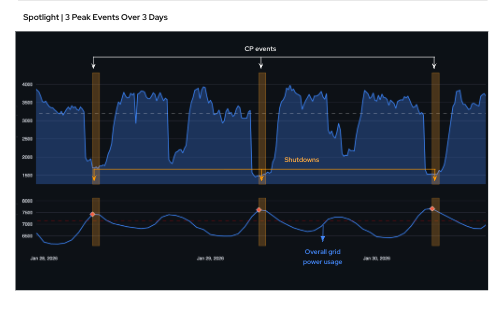
Coincident Peak demand occurs when the demand for electricity is at a maximum in a utility or Independent System Operator (ISO) service territory. In PJM as an example, there are five Coincident Peak events measured per power year.
Over just a handful of hours throughout an entire month, your facility’s energy use can drastically impact your monthly bill. Coincident Peaks can occur, rates can spike and opportunities for Demand Response can become available.
Transmission and capacity charges are often based on a site’s contribution to the grid during a small number of annual peak intervals. Coincident peak avoidance is one of the highest-value actions an industrial facility can take, yet it requires a response window measured in minutes, not hours. Miss one peak, and your costs are locked in for the next year.
During the recent vortex, automated curtailment reduced average site load from a 3.5 MW baseline to roughly 1.54 MW during peak intervals.
These are not seasonal adjustments. They are sharp, narrow price events that can occur over:
- A single morning peak
- A 2–3 hour scarcity window
- A handful of days during extreme weather
The shorter the window, the harder it is to respond manually.
Capturing Savings During Extreme Weather Events
Consider the performance of a small subset of facilities at one of the largest global owners and operators of temperature-controlled warehouses in response to January’s polar vortex.
Six sites avoided coincident peak events, shedding 2,600 kW on average, representing an estimated $285,000 in potential transmission-cost reduction for 2027.
A quick note on timing: transmission charges are set by the top five peaks. Summer peaks are common, but last year winter peaks were also in the top five, so it’s plausible that one or two of these events would count toward next year’s top-five peaks and turn this potential saving into realized savings.
Why Manual Response Fails When It Matters Most
Today, most industrial facilities rely on manual processes to manage electricity price spikes - and the gap between manual and automated response is where the real cost lives. Markets and rate structures make manual oversight unmanageable.
Day-Ahead Markets
You get at least one day of notice, but someone still has to:
- Monitor incoming rate schedules
- Interpret pricing signals (sometimes more than one a day)
- Weigh the trade-offs of load shedding
- Coordinate operational changes across teams and systems
- Execute each response manually
Real-Time Markets
Rates update every five minutes. Real-time energy cost spike response at that speed is nearly impossible to execute manually - by the time they begin, the window has closed:
- An energy consultant watches the market
- A call or email goes out
- Operations decides whether shutting down is worth the disruption
- By the time action is taken, the highest-priced interval has already passed
Many facilities simply miss real-time opportunities altogether. And in some cases, companies avoid more advantageous rate structures because they can’t respond fast enough. The risk is too high.
Three Scenarios: No Action vs. Manual vs. Automated
Consider three different response scenarios for a typical extreme weather event:
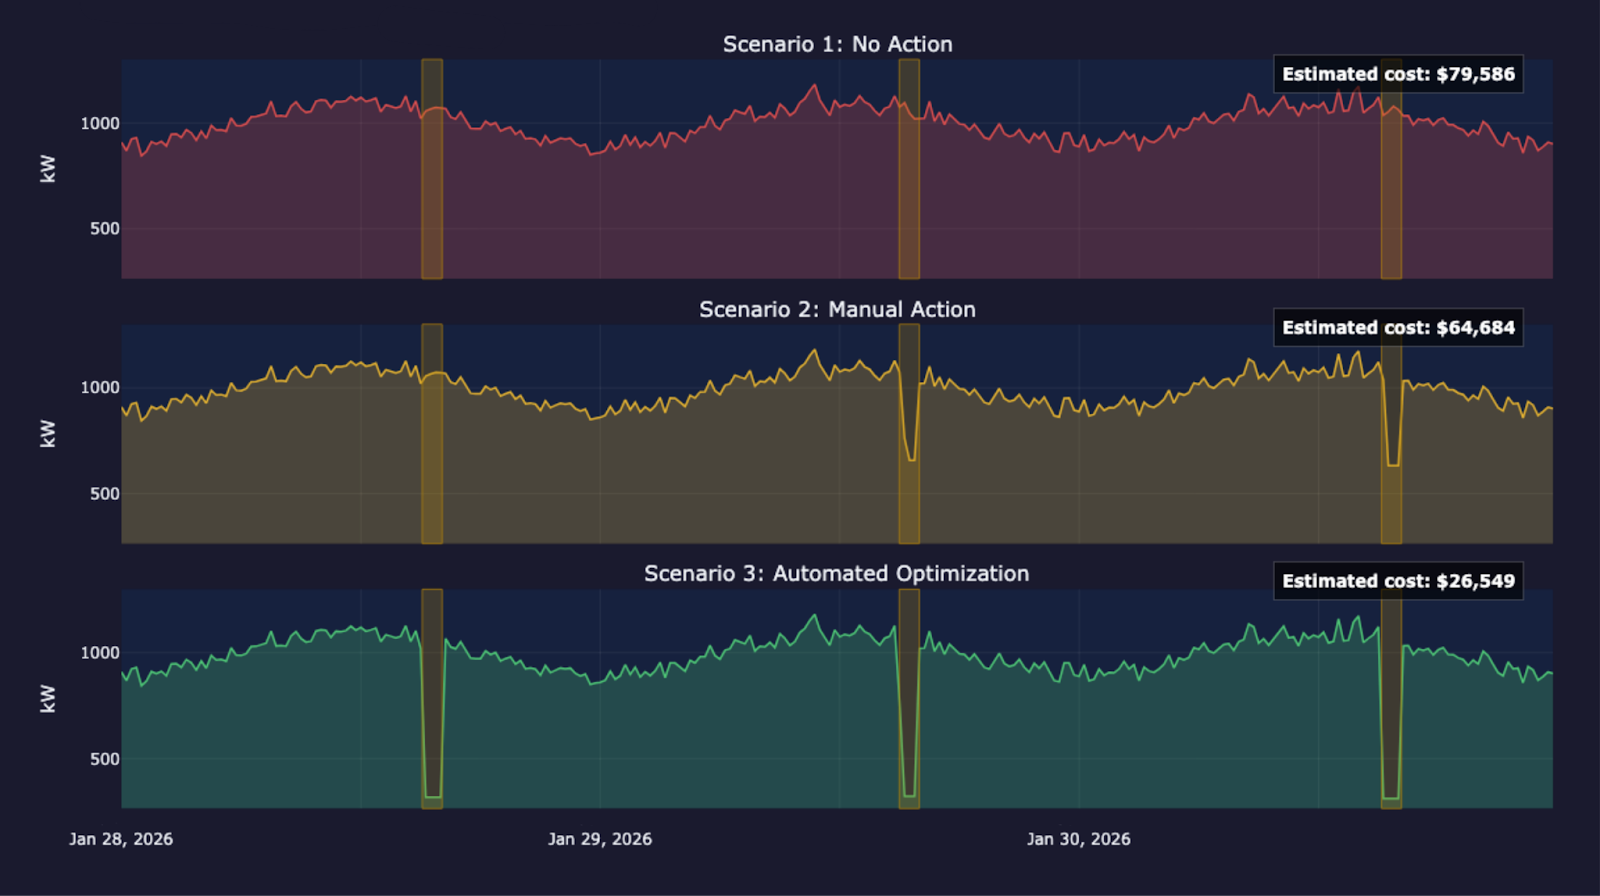
Scenario 1: No Action
- Site runs normally
- Full exposure to rate spikes
- Transmission peak potentially set
- Estimated savings: $0
Scenario 2: Manual Action
- Some CP intervals captured
- Some missed due to delayed response
- Partial savings captured
- Estimated savings: $14,902
Scenario 3: Automated Optimization
- System detects rising rates and curtails automatically
- Coincident Peak events mitigated
- No manual intervention
- Estimated savings: $50,037
This is where automation changes the equation.
How Automated Energy Response Works in Practice
Consider one of the world's largest temperature-controlled industrial REITs, leveraging ATLAS to automate energy strategy across their portfolio.
At just a handful of sites, they captured over $200,000 by automating responses to more than 37 DR events in a single week. Automated shutdowns and load curtailment drove an additional $140,000 in net new savings - delivering $340,000 in total value.
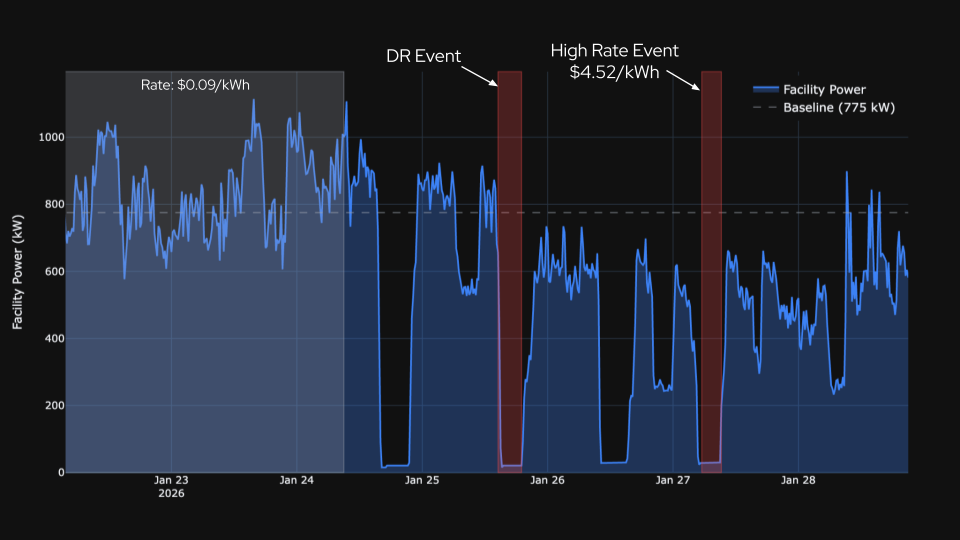
Spotlight on one site in the Mid-Atlantic region
At a single site in Maryland, energy rates spiked 50x — jumping from $0.09 to $4.52/kWh. Heavy snow and frozen conditions made it impossible for operations teams to physically reach the site, but ATLAS stepped in autonomously, anticipating the surge and responding in real time.
The result: more than $70,000 in avoided energy costs, roughly 75% of the site's average monthly energy spend - savings they would have had no way to capture on their own.
What Automation Enables
During the recent polar vortex:
- 100x+ rate spikes were mitigated automatically for ATLAS sites
- Dozens of Demand Response events were captured in a single week
- Industrial load curtailment automation shed an average of 2.6 MW per site during coincident peak events
- Transmission peaks were curtailed with no manual intervention
No one had to:
- Watch the screen at 6:45 AM
- Calculate whether shedding was worth it
- Choose between operational pressure and financial risk
The system was already prepared.
ATLAS continuously optimizes for lowest cost within operational constraints. It recognizes rising energy use. It recognizes pricing signals. It acts without waiting for human approval during time-critical intervals.
That removes:
- Human error
- Delayed decisions
- Missed intervals
- Emotional risk calculations
And it unlocks something important: certainty.
As Jesse Tootell, Director of R&D at Lineage notes, “Companies are willing to pay for certainty. Automation provides it.”
Watch our recent webinar, Built for Volatility, featuring Jesse Tootell>
Full Shutdown Isn't Required
For processing and manufacturing sites, full shutdown isn’t always an option. But curtailment does not require turning everything off.
Options include:
- Strategic load shifting
- Temporary reduction of non-critical systems
- Pre-cooling strategies
- Demand shaping that protects product and throughput
During extreme cold or heat snaps, operators are already managing operational risk. Energy market monitoring should not add to that burden.
Automation allows sites to:
- Protect critical processes
- Maintain productivity
- Reduce exposure during the most expensive intervals
- Participate in more beneficial rate structures without additional operational risk
Extreme Events Are Short. The Financial Impact Is Not.
The reality:
- Five hours of transmission peaks can define next year’s costs
- A single week of volatility can deliver a six figure cost impact
- Day-ahead rates can spike 30x–100x above normal
Extreme weather events may last days. The pricing chaos may last hours. The financial consequences can last years.
The grid will continue to face:
- Record heat waves and cold snaps
- Aging infrastructure under growing strain
- Rolling blackouts and grid emergencies
- Volatile energy pricing with little warning
- Rising demand with fewer reliable sources
The question is no longer whether volatility will happen. It's whether your facility will respond in time to protect your bottom line and reduce your impact.
The next grid event won't wait for a manual response. Your facilities should be ready before the next price spike hits, not after.

Stay Connected
Subscribe to stay in the loop on the latest industry news.
Related Posts